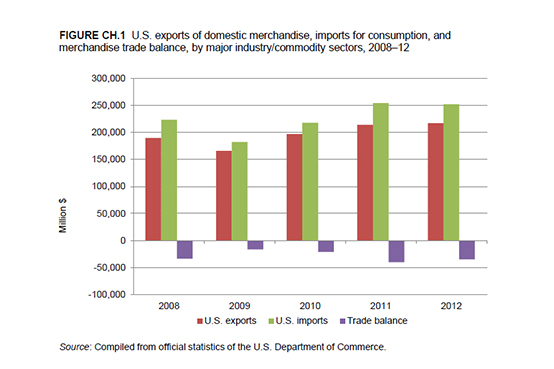
Change in 2012 from 2011:
- U.S. trade deficit: Decreased by $5.5 billion (14 percent) to $34.7 billion
- U.S. exports: Increased by $3.5 billion (2 percent) to $217.5 billion
- U.S. imports: Decreased by $2.1 billion (1 percent) to $252.2 billion
After increasing steadily from 2009 to 2011, the U.S. trade deficit in chemicals and related products shrank by $5.5 billion (14 percent) in 2012 (figure CH.1). Having made strong gains in both imports and exports through 2011, U.S. exports slowed in 2012, growing by only 2 percent, while U.S. imports declined by 1 percent. The loss of momentum in both flows was largely attributed to weaker markets in the European Union (EU) and China and slow growth in the United States. On a sector basis, pharmaceuticals accounted for the largest share of U.S. trade in chemicals over the entire period, representing about one quarter of exports and 35-45 percent of imports.
U.S. Exports
U.S. exports of chemicals increased by $3.5 billion (1.6 percent) to $217.5 billion in 2012. The low growth rate (compared to 19 percent in 2010 and 9 percent in 2011) was attributed largely to the recession in the EU and slowing demand in the Chinese market. While annual U.S. export levels to the EU have fluctuated in the past, this tendency has been less pronounced in recent years, remaining almost constant in 2011-12. Products such as inorganic chemicals, petrochemicals, and plastic resins were among the products affected by the economic downturn in the EU, largely as a result of declining demand from the automotive and construction sectors. Although overall U.S. exports of chemicals to Asia grew by 23 percent during 2008-12, these exports declined by 4 percent between 2011 and 2012. Notably, U.S. exports of chemicals to China decreased by 5 percent in 2012. Products accounting for much of this decrease included intermediate chemicals and some end products, such as pesticides and paints, likely reflecting the widespread contraction in China's manufacturing sector.
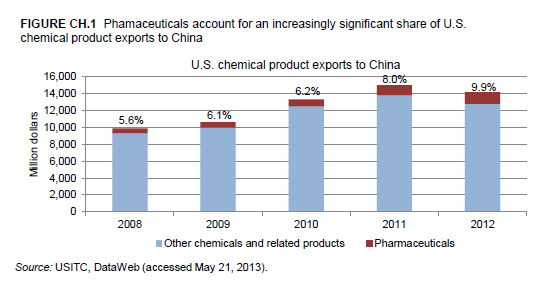
While overall U.S. exports of chemicals to China declined in 2012, exports were up in certain commodity groups. Exports of pharmaceuticals, for example, grew by 16 percent in 2012, tempering the overall decline. China's continued healthcare reform, coupled with growing personal income levels in the country, has contributed to a strong, steady increase of 151 percent in U.S. exports of pharmaceuticals to the country during 2008-12 (figure CH.2).4 U.S. exports to China of chlor-alkali chemicals showed the greatest growth in 2012 — a 143 percent increase — largely because of China's build-up of production capacity for polyvinyl chloride (PVC). Chlor-alkali chemicals are an input in the production of PVC, which is used in numerous applications, including products for the housing and construction industries.
U.S. Imports
In 2012, U.S. imports of chemicals and related products dipped by $2.0 billion (1 percent) to $252.2 billion after steadily increasing since 2009. On a monthly basis in 2012, U.S. imports increased irregularly through May before slowing through the rest of the year. Industry sources suggested the slowing might be temporary, attributing it to corporate and consumer concern about economic developments in the United States in 2012, including the then-pending "fiscal cliff."
In 2012, import flows from the United States' largest regional partners showed mixed changes, with U.S. imports from Asia increasing by 5 percent while U.S. imports from the EU generally declined. Slow growth in the U.S. chemical industry's downstream manufacturing customer base spurred the overall decline in U.S. imports of chemicals. Within the EU, the largest decline (20 percent) occurred in imports from Ireland, a major U.S. supplier of pharmaceuticals. One industry source cites the expiration of the U.S. patent on as many as 10 blockbuster drugs (e.g., Lipitor) as accounting for much of this decline.


