Christopher Robinson
(202) 205-2602
christopher.robinson@usitc.gov
Change in 2013 from 2012:
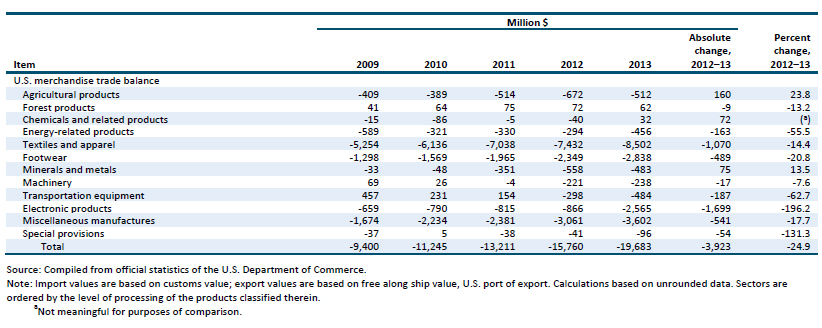
- U.S. trade deficit: Increased by $3.9 billion (25 percent) to $19.7 billion
- U.S. exports: Increased by $400 million (8 percent) to $4.7 billion
- U.S. imports: Increased by $4.3 billion (21 percent) to $24.4 billion
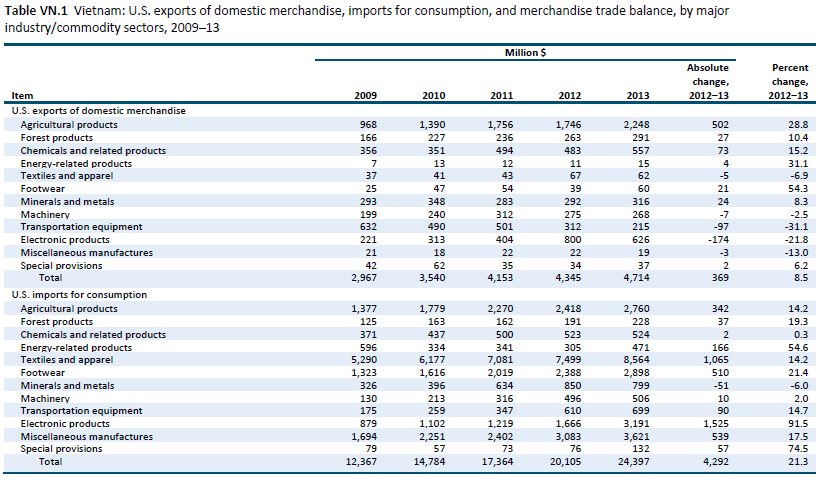
The U.S. trade deficit with Vietnam increased by $3.9 billion in 2013, as a $4.3 billion increase in U.S. imports was only partially offset by a $400 million increase in U.S. exports (figure VN.1 and table VN.1). This shift principally reflects Vietnam’s increasing ability to compete with other U.S. import sources. During 2013, the Vietnamese economy expanded by 5 percent, and exports and foreign direct investment were major factors in this growth. Exports grew by 15 percent, while Vietnam’s exports-to-GDP ratio rose to 75 percent in 2013 from 56 percent in 2009. Disbursed foreign direct investment increased 10 percent, and pledged foreign direct investment rose 55 percent


U.S. Exports
U.S. exports to Vietnam increased by $400 million to $4.7 billion in 2013 (up 8 percent from 2012). U.S. exports to Vietnam grew in seven of the sectors shown in table VN.1, with one sector, agricultural products, accounting for most of the overall increase in exports (table VN.2).

U.S. exports of agricultural products increased by $500 million, due to a combination of higher domestic Vietnamese consumption of animal feed and an increase in Vietnamese imports of edible nuts. U.S. exports of animal feed to Vietnam rose by $171 million (74 percent) in 2013. Changes in Vietnamese eating habits, coinciding with recent economic growth, have spurred growth in the domestic livestock sector. Domestic and foreign investment have increased Vietnamese capacity for animal feed production, but this growth was insufficient to meet the rapid rise in feed demand in 2013. As a result, Vietnam increased its imports of U.S. animal feed, including corn, wheat, and soybeans.
In 2013, U.S. exports to Vietnam of edible nuts rose by $173 million (106 percent). Much of this increase was in peanuts, with exports increasing by $97 million (an over 80-fold rise). In part, this reflects global trends in the peanut market: the U.S. had its largest crop ever, while two other leading exporters, India and Argentina, had smaller crops than in 2012. China also supplied fewer peanuts to the global market in 2013, owing to increased domestic demand for peanuts (used to produce peanut oil). In fact, U.S. exports to Vietnam included purchases in Vietnam to supply the Chinese market. This practice was reportedly halted in April by Chinese authorities, but likely contributed to the increase in U.S. exports to Vietnam for 2013.
U.S. exports of cotton, not carded or combed, increased $153 million (62 percent). During 2013, Vietnamese imports of cotton increased as demand rose, driven by an increase in yarn production capacity. India, typically a major cotton exporter, produced less cotton than expected in 2012, opening opportunities for U.S. cotton exporters in Vietnam. Yarn produced in Vietnam is both exported directly and consumed domestically by the export-oriented textile and apparel industries.
U.S. Imports
U.S. imports from Vietnam rose by $4.29 billion (21 percent) to $24.4 billion in 2013. Three sectors—electronic products, textiles and apparel, and footwear—accounted for $2.6 billion of this increase. A common set of competitive factors, including low labor costs, a large labor pool, and proximity to existing supply chains, enabled Vietnam to increase its share of U.S. imports compared to other sources. Specifically, multiyear increases in labor costs in China, which is the largest U.S. import source in these sectors, provided an incentive for foreign investors to also locate some production facilities in other nearby countries. Vietnam was a primary beneficiary of this trend.
U.S. imports of electronic products from Vietnam increased by $1.53 billion (92 percent) to $3.2 billion, while U.S. imports of electronic products from all sources rose by 0.8 percent. Much of the increase in imports from Vietnam resulted from investment in production facilities by multinational companies. The importance of foreign direct investment is demonstrated in mobile phones, where Samsung accounted for 98 percent of Vietnam’s 2013 exports.
U.S. imports of textiles and apparel from all sources increased by 3 percent in 2013. U.S. imports of textiles and apparel from Vietnam, however, increased by 14 percent ($1.1 billion) to $8.6 billion, and Vietnam’s share of total U.S. imports in this sector increased from 6.6 percent to 7.3 percent. Vietnam’s textile and apparel industry benefits from low labor costs relative to other exporting countries.
U.S. imports of footwear from Vietnam increased by $510 million (21 percent) to $2.9 billion. U.S. imports of footwear from all sources increased 4 percent, while Vietnam’s share of U.S. imports increased from 10 percent to 12 percent. As with textiles and apparel, the Vietnamese footwear industry benefits from comparatively low labor costs. Vietnamese operations associated with foreign direct investment accounted for an estimated 76 percent of Vietnam’s total exports in the footwear sector.


