 An official website of the United States government.


Mihir P. Torsekar
(202) 205-3350
mihir.torsekar@usitc.gov
Change in 2013 from 2012:
- U.S. trade deficit: Increased by $5.9 billion (8 percent) to $78.5 billion
- U.S. exports: Increased by $7.3 billion (3 percent) to $293.0 billion
- U.S. imports: Increased by $13.1 billion (4 percent) to $371.5 billion
In 2013 the U.S. trade deficit in transportation equipment increased for the fifth straight year, as import growth exceeded export growth by $5.9 billion (table TE.1). The expansion of the sectoral deficit was principally fueled by increased imports of motor vehicles and of aircraft, spacecraft, and related equipment (aircraft and related equipment), coupled with a $6.2 billion drop in exports of construction and mining equipment.
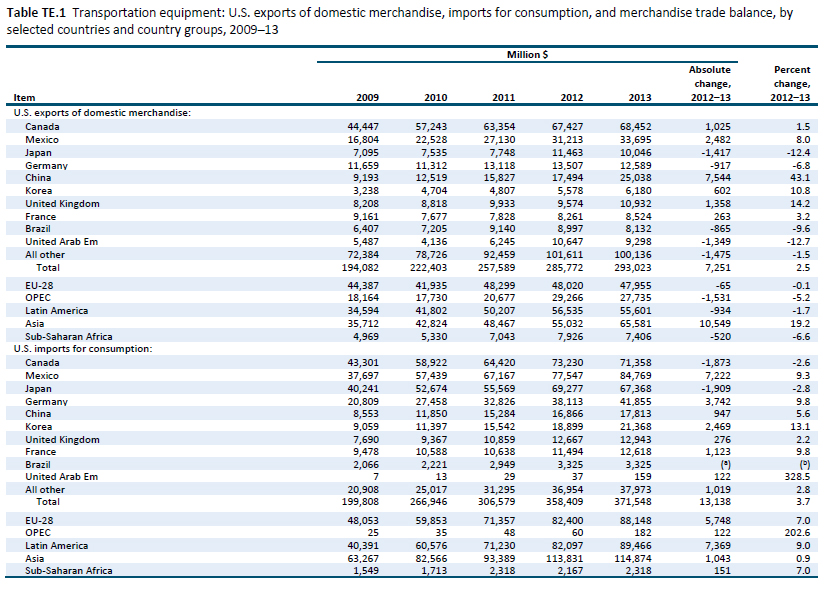
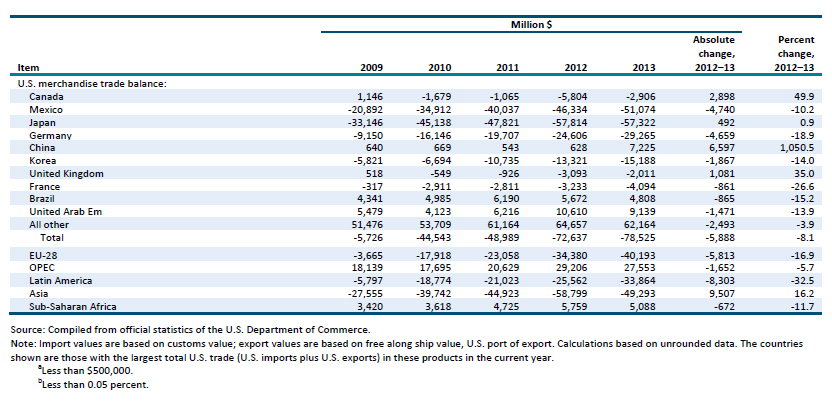
The United States maintained a trade deficit within the transportation equipment sector with four of its top five trading partners, including Canada, Mexico, Japan, and Germany; China was the lone exception. In 2013, the U.S. bilateral trade surplus with China for transportation equipment increased by $6.6 billion (more than 1,000 percent) to $7.2 billion, reflecting China’s rapidly growing demand for aircraft and related equipment and, to a lesser extent, motor vehicles.
U.S. Exports
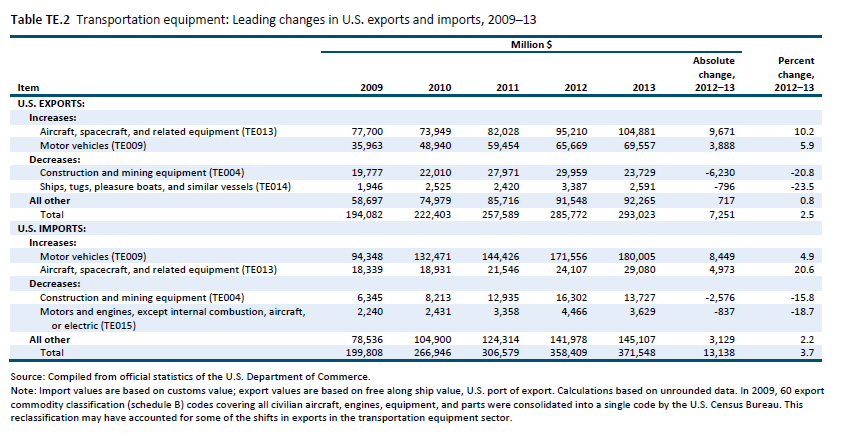
The $7.3 billion (3 percent) increase in U.S. transportation equipment exports in 2013 to $293.0 billion was driven by a $9.7 billion increase in aircraft and related equipment, along with a $3.9 billion increase in motor vehicles (table TE.2). Exports of aircraft and related equipment, which represented more than one-third of total sectoral exports, primarily reflected U.S.-based Boeing’s near-record global deliveries of jets and civil aircraft in 2013. The company delivered 648 jets in 2013, eclipsing its previous record of 620 from 1999.240 The aircraft delivered in 2013 had been ordered by airlines and leasing companies in previous years, as the production time and waitlist for large civil aircraft can stretch from many months to several years. (While companies account for the sales differently, the trade value is registered only when the plane is delivered.) Airlines have been ordering more aircraft because of increasing traffic, as measured by revenue passenger miles. Carriers have also taken advantage of lower borrowing costs to replace existing fleets with more fuel-efficient planes; Boeing is one of the world’s leading manufacturers of these aircraft.
China remained the largest export market for U.S. aircraft equipment in 2013. It registered both the largest absolute growth in aircraft equipment imports from the United States ($12.1 billion) and the largest percentage increase (53 percent). The country is already the world’s second-largest aircraft market, and growing travel demand from within the country, along with an increase in air cargo, is translating into rapid growth in demand for aircraft. About half of China’s new aircraft are supplied by Boeing.
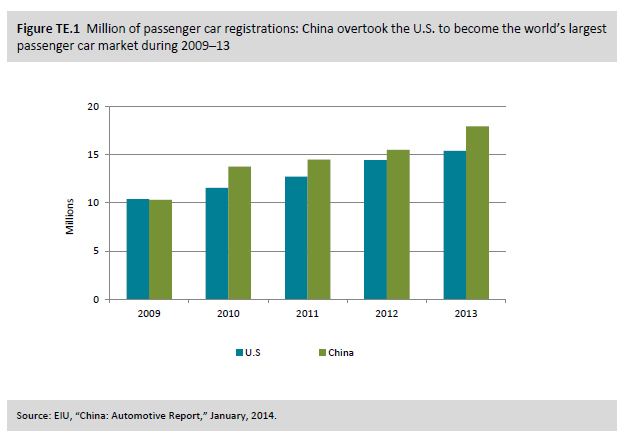
The growth in U.S. exports of motor vehicles principally resulted from increased demand for passenger vehicles in China, which has the world’s largest passenger vehicle market. The $2.8 billion (51 percent) increase in U.S. exports of passenger vehicles to China during 2012–13 was the largest value gain recorded during the five-year period 2009–13 (see part II, “China,” figure CN.2). In quantity, the United States exported 80,597 more passenger vehicles in 2013 than in 2012—a 49 percent increase–to reach 246,915 vehicles exported to China. China registered 17,929,000 passenger vehicles in 2013 (figure TE.1), so U.S. imports accounted for just over 1 percent of the Chinese market. Passenger car registrations in China increased 16 percent from the previous year and 74 percent over the 2009–13 period, as shown in figure TE.1, reflecting the country’s increased wealth, better roads, and greater access to financing options.244 Albeit from a small base, sales of U.S. vehicles in China increased by nearly 50 percent in 2013, as Chinese consumers began to choose U.S.-made vehicles over Japanese ones; sales of Japanese vehicles in China have declined since 2012, owing to an ongoing dispute over territory in the East China Sea. Exports of motor vehicles to regional partners Canada and Mexico also increased slightly, although these increases totaled only a combined $1.7 billion and remained consistent with growth during the previous five years. These markets remained significant destinations for U.S. motor vehicles, owing to the integration of the motor vehicle industry in North America stemming from NAFTA.
Strong export growth in the aircraft and motor vehicles sectors was tempered by a $6.2 billion (21 percent) reduction in U.S. exports of construction and mining equipment. These exports dropped to $23.7 billion in 2013, as exports to four of the United States’ five leading markets fell by a combined $4.4 billion; more than two-thirds of this decline occurred in Australia and Canada. Reasons for the decrease varied, but included difficulties in securing skilled labor in these two markets in particular, along with rising input costs and a focus on completing projects delayed by the recent global economic recession.
U.S. Imports
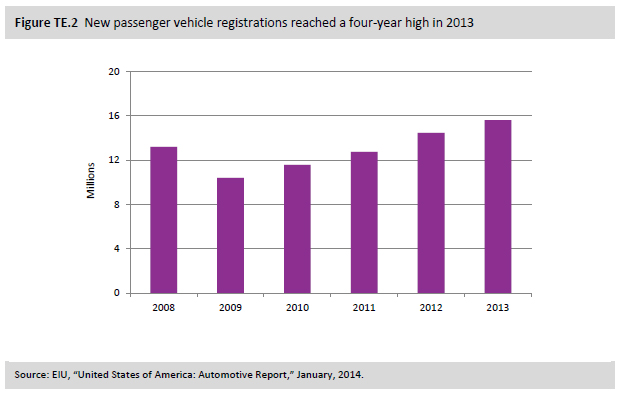
The largest contributors to the growth in U.S. imports of transportation equipment in 2013, in terms of absolute value, were the motor vehicle and aircraft equipment industries. Imports of the former rose by $8.4 billion (5 percent) to $180.0 billion, while imports of the latter grew by $5.0 billion (21 percent) to $29.0 billion. Relatively strong U.S. motor vehicle imports resulted, in part, from wider access to credit; increased consumer confidence, stemming from the ongoing economic recovery; and improved household wealth, owing to declining unemployment rates and stock market gains. In particular, sales of light motor vehicles in the United States increased by 8 percent to 15.6 million units during 2013, the highest level recorded since the economic recession (figure TE.2).
Imported motor vehicles from Mexico and Germany, the United States’ second- and fourth-leading suppliers of these goods in 2013, increased by 14 and 10 percent, respectively. Mexico has emerged as one of the leading destinations for motor vehicle production, due in large part to the country’s relatively low labor costs and proximity to the large U.S. market, which imports these goods duty-free under NAFTA. Many of the world’s largest manufacturers have recently established manufacturing facilities within the country, including Nissan, Mazda, and Honda.249 German-based manufacturers enjoyed success in the United States during 2013 due to increased marketing campaigns and greater investments in new dealerships. These efforts may have translated into the nearly threefold increase seen in purchases of these vehicles—especially Volkswagens.
Increased U.S. imports of aircraft and related equipment resulted from domestic carriers replacing their fleets with more fuel-efficient aircraft types. Many of these aircraft were produced by Airbus in Europe and Embraer in Brazil, and then exported to the United States.