Change in 2012 from 2011:
- U.S. trade deficit: Decreased by $6.9 billion (27 percent) to $19.1 billion
- U.S. exports: Increased by $2.3 billion (31 percent) to $10.0 billion
- U.S. imports: Decreased by $4.6 billion (14 percent) to $29.0 billion
The U.S. trade deficit with Russia fell by $6.9 billion (27 percent) to $19.1 billion between 2011 and 2012, largely due to shifts in demand. The top three U.S. export sectors — transportation equipment, machinery, and agricultural products — accounted for 74 percent of total U.S. exports to Russia and grew, in part, due to strong Russian demand and Russia's World Trade Organization (WTO) commitments liberalizing access to the Russian market. The decrease in U.S. imports from Russia was primarily driven by energy-related products. Imports in this sector fell by $3.1 billion (12.7 percent) in 2012 amid reduced U.S. consumption of petroleum products coupled with increased U.S. production of these commodities (figure RU.1).
U.S. Exports
U.S. exports of transportation equipment to Russia, increased by 44 percent to $3.7 billion, $2.2 billion of which was aircraft and motor vehicles. Expanding Russian demand for exports reflected several factors. Aircraft traffic in Russia is expected to increase 6 percent per year over the next 20 years, but the domestic fleet is aging and production capacity is modest. Western competitors have gained a strong market presence; the share of foreign aircraft in the Russian air fleets was estimated at 74 percent in 2011.
U.S. motor vehicle exports to Russia rose by $370 million in 2012. Growth in U.S. motor vehicle exports reflected Russia's increasing demand for automobiles and the country's growing automobile market. Between 2009 and 2012, new passenger vehicle registrations increased by 101 percent to nearly 3 million cars — more than twice the growth rate of China, the United States, Japan, and Germany during this time. In Russia there is reportedly a strong demand for foreign-branded motor vehicles because of foreign brands reputation for superior quality; these vehicles are both imported and domestically produced by joint ventures between foreign and domestic companies.
The machinery sector was the second-largest category of U.S. exports to Russia in 2012, increasing by $454 million to $1.8 billion. Exports within this sector were principally driven by a $100 million expansion in exports of farm and garden machinery equipment, again owing to increased demand in Russia. Russia needs to modernize its agricultural inventory significantly; the age of most harvesters in Russia exceeds their service life. The United States was among the world's top five suppliers of high-value farm equipment — such as tractors and harvesting machines — to Russia in 2012, and U.S. exports, although $282 million below pre-recession-levels in 2008, grew 29 percent during 2011-12 to $439 million.
The third-largest export sector was exports of agricultural products, which reached $1.7 billion following a $415 (32 percent) increase during 2011-12. This growth was largely attributed to increased U.S. exports of meat, such as beef and pork. Russia, the United States' sixth leading export market for meat in 2012, has achieved an 8 percent annual growth rate in meat consumption since 2008 and reached a record-high 10 percent year-on-year rate of growth in 2012 to 146 pounds per capita. This largely reflects the country's economic growth; Russia's GDP grew by 3.4 percent in 2012, which compared favorably to growth in the global economy.
Another likely contributor to increased consumption of poultry and beef, in particular, was Russia's August 2012 WTO accession, which liberalized the country's agricultural market. The United States' tariff-rate quota for frozen beef increased from 47,000 to 60,000 metric tons; for certain poultry products, from 350,000 to 364,000 metric tons. Between August and December 2012, U.S. exports of these goods, collectively, increased by $466 million.
U.S. Imports
The $4.6 billion reduction in U.S. imports from Russia was primarily due to declines in the energy- related products sector, which fell by $3.1 billion (12.7 percent) to $21.6 billion. Petroleum products and crude petroleum, registered the most significant import declines within this sector.
The United States imported 44 million fewer barrels of crude petroleum from Russia in 2012, reflecting increased U.S. domestic production coupled with reduced U.S. demand for petroleum. Similarly, U.S. imports of petroleum products from Russia declined by 8.7 million barrels to 137.6 million barrels in 2012, reflecting decreased U.S. consumption of distillate and residual fuel oils — the primary petroleum products imported from Russia — used for heating because of a mild winter. U.S. imports from Russia of unfinished oils — such as naphtha, kerosene, and residuum — did increased slightly. However, imports of unfinished oils typically represent only 5-10 percent of total energy-products imports from Russia. Therefore, the increase in these imports was not enough to offset the large drops in distillate and residual fuel oil imports.
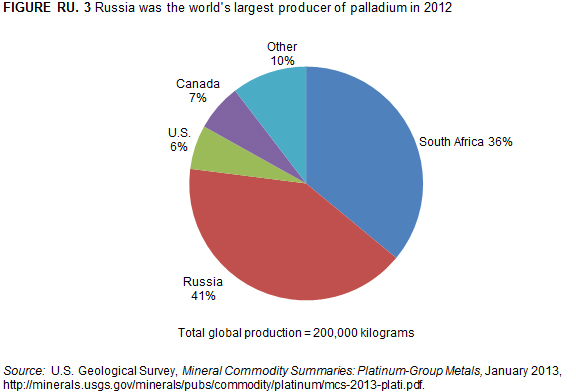
U.S. imports of certain minerals and metals also declined in 2012. The drop of $538 million (10.8 percent) was due largely to decreased imports of palladium, which is principally used to manufacture catalytic converters for automobiles. Russia is the world's largest producer of palladium and its government stockpile has historically supplied significant quantities to the global market (figure RU.3). Industry sources believe reduced U.S. imports of palladium from Russia are a result of stagnating Russian production and dwindling stockpile supplies.


